

U.S. Equities Have Lost -$2.6 Trillion In Market Value Since Mid-July
Excessive equity valuation concerns remain despite recent losses

Highlights
Excessive equity valuation concerns remain despite recent losses
Income trends don’t ratify the glow to Q2 GDP
Equal and cap-weighted S&P 500 divergence is a reminder of the Tech bubble
Flat lending growth doesn’t comport with a “resilient economy”
While We Were Sleeping
Talk about another wild day full of equity market gyrations — but no bounce from the Wednesday drawdown. The dip-buyers in the morning got crunched in the afternoon (will they return?). This market has become unglued, to say the least:
A 503-point drop in the Dow from the intra-day high to the close. What is up with that?
For the Nasdaq, stocks fell -1.8% to start the day, before rebounding to a high of +1.2% before rolling over and closing down -0.9% (and off nearly -8% from the peak).
For the S&P 500, stocks went from being down -0.7% before rising to a daily gain of +1.2% to then close down -0.5% — 90 points off the highs!!
The junky Russell 2000 jumped +1.3% but also closed off its highs and has been outperforming like mad — why? Because their balance sheets are so leveraged, and this sector so hitched to short-term debt, that they are foaming at the mouth over looming Fed rate cuts. I am steering clear.
Our Equity Momentum Model is still “green” on the official 5-day moving average basis; however, the “spot” daily number has come in at “neutral” for two days in a row… something to keep an eye on. It looks set to flip. This is looking a whole lot like the action we saw unfold in March 2000 when that tech bubble began to pop. And it must be said that even with this Great Rotation to small-caps with horrible balance sheets, the overall market cap of equities (Wilshire 5000) saw valuations fall -$190 billion yesterday bringing the total loss to -$2.6 trillion in less than two weeks! This is the net effect of big caps giving it up to small caps from a total market value standpoint — this is something we have not seen happen since September 2022.
The challenge of excessive valuations has not gone away: A 21x forward P/E multiple represents a 4.75% earnings yield or a mere 50 basis point ERP. That is a headwind.
The complacency to this day remains scary: The Investors Intelligence Bull-Bear spread has moved to a dangerous extreme of nearly 50 percentage points (bulls at 64.2% and bears at 14.9%). This is the “herd effect” on steroids.
And remember, we have been working off this other extreme condition in terms of price overextension when the S&P 500 approached that 15% gap above its 200-day moving average, in one word or less: stretched.
The bond market managed to maintain its rally despite the hotter-than-expected GDP and core PCE deflator — and why not? Look at what the industrial metal price index is doing — freefall. Down nine days in a row and off -17% from the late-May nearby high. Now how inflationary is that (not very)?

Now to the economy: Fully 80% of that reportedly solid +2.8% SAAR print in real GDP growth in Q2 came from three sources: savings rate drawdown (the wealth effect!), the beloved government sector (thanks Joe!) and inventory building (looks unintended). Outside of these — the headline would have come in at a +0.6% stall-speed pace. We shall see in Q3 the extent to which these three support mechanisms were permanent or temporary.
There remains a huge discrepancy between spending and income. Consumer spending in real terms came in at +2.3% at an annual rate, but real after-tax personal incomes only inched up +1.0%. On a YoY basis, volume spending is running at +2.5% versus only +0.9% for real disposable earnings. What we know about history is that gaps between these two series close over time. And what tends to happen is that spending follows income — not the other way around.
As far as the overnight trade is concerned, we are seeing a positive turnaround. U.S. futures are squarely in the green. European markets have gained +0.6% thus far. Outside of Taiwan (-3.3%) and Japan’s Nikkei 225 (-0.5%), Asia enjoyed a rare advance: India (+1.5%), Korea (+0.8%), Thailand (+0.8%), and Hong Kong (+0.1%). Bond yields have bounced a touch — especially in Europe, where 10-year rates are up around +3 basis points.
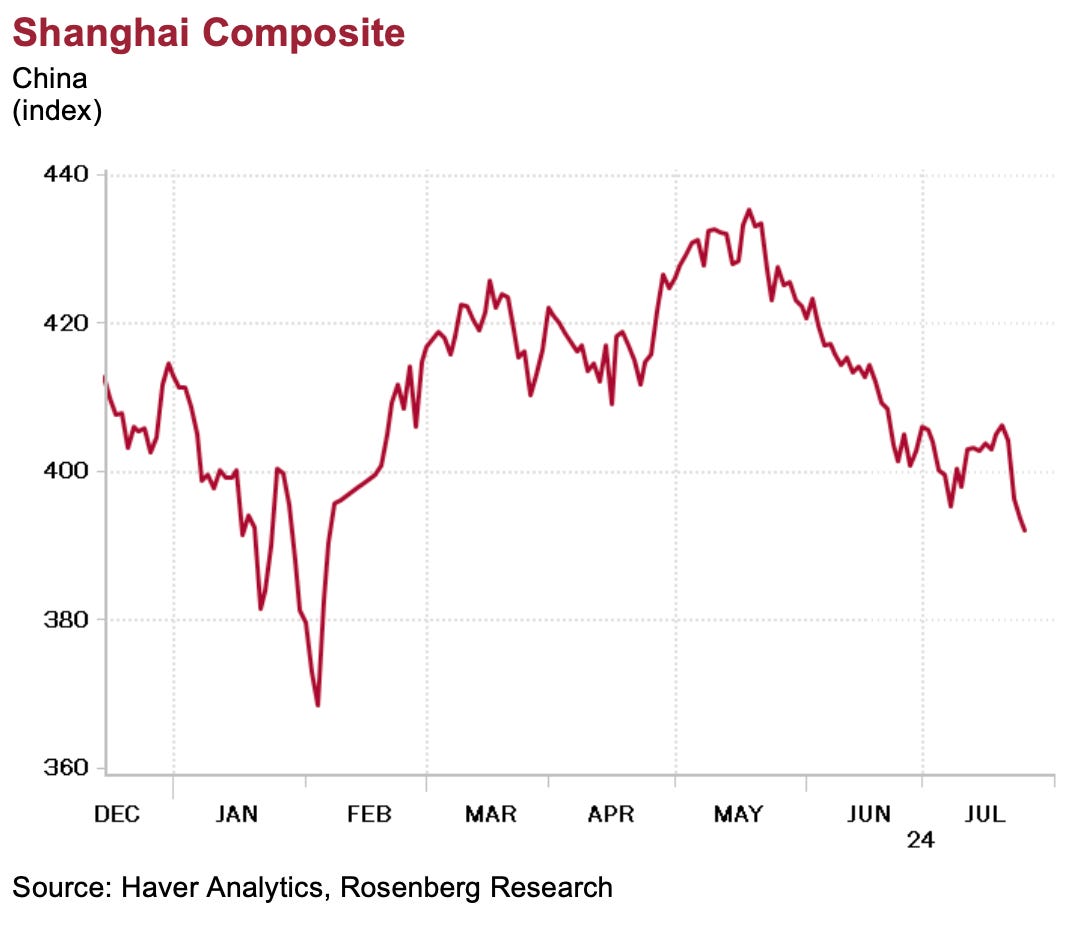
China is a notable exception, where the 10-year benchmark yield fell to as low as 2.17% today — a record-low, in fact. This, along with the fact that the Shanghai Composite is off -2.8% year-to-date, are clear signs that the markets are pricing in a recession and deflation in the world’s second largest economy. The DXY dollar index is hanging in at the 200-day moving average at 104.35. Spot gold ($2,369 per ounce) is up +0.2% while Brent crude ($82.57 per barrel) is flat, but Bitcoin has stolen the show with a +2.6% run-up to $66,971 (all market quotes are time-stamped to 4:30 a.m. ET).

On the data front, more pressure came to bear on the BoJ with the Tokyo core CPI inflation rate inching up to +2.2% in July from +2.1% in June (a BoJ rate hike would be bullish for one group in particular — the financials… have a look at Japan Is The Land of Rising Banks on page B10 of the WSJ). Yet another bullish article on the U.K. surfaced today in the lead editorial piece in the FT — Investor Appetite Returns to Britain on page 18 (who would have thought this would happen with the Conservatives handing the reins to Labour?).
